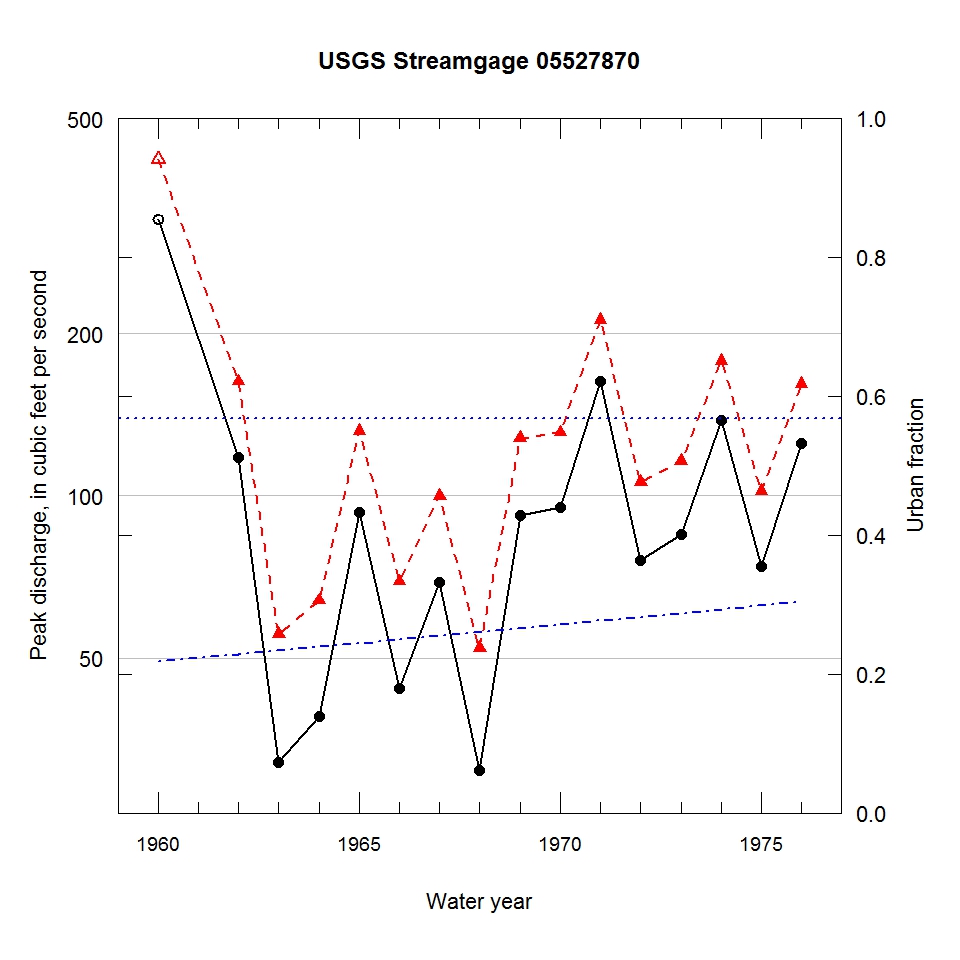
Observed and urbanization-adjusted annual maximum peak discharge and associated urban fraction and precipitation values at USGS streamgage:
05527870 MILL CREEK AT WEDGES CORNER, IL


| Water year | Segment | Discharge code | Cumulative reservoir storage (acre-feet) | Urban fraction | Precipitation (inches) | Observed peak discharge (ft3/s) | Adjusted peak discharge (ft3/s) | Exceedance probability |
| 1960 | 1 | 7 | 0 | 0.218 | 0.548 | 326 | 420 | 0.011 |
| 1962 | 1 | -- | 0 | 0.229 | 0.251 | 118 | 163 | 0.223 |
| 1963 | 1 | -- | 0 | 0.234 | 1.538 | 32 | 55 | 0.921 |
| 1964 | 1 | 4B | 0 | 0.239 | 0.251 | 39 | 64 | 0.880 |
| 1965 | 1 | -- | 0 | 0.244 | 0.769 | 93 | 132 | 0.396 |
| 1966 | 1 | -- | 0 | 0.250 | 0.482 | 44 | 69 | 0.847 |
| 1967 | 1 | -- | 0 | 0.255 | 1.318 | 69 | 100 | 0.630 |
| 1968 | 1 | -- | 0 | 0.260 | 0.544 | 31 | 52 | 0.932 |
| 1969 | 1 | -- | 0 | 0.266 | 1.387 | 92 | 128 | 0.421 |
| 1970 | 1 | -- | 0 | 0.271 | 1.615 | 95 | 131 | 0.401 |
| 1971 | 1 | -- | 0 | 0.276 | 0.454 | 163 | 212 | 0.098 |
| 1972 | 1 | -- | 0 | 0.282 | 0.468 | 76 | 106 | 0.586 |
| 1973 | 1 | -- | 0 | 0.288 | 1.418 | 85 | 116 | 0.501 |
| 1974 | 1 | -- | 0 | 0.293 | 1.140 | 138 | 178 | 0.175 |
| 1975 | 1 | -- | 0 | 0.299 | 0.841 | 74 | 102 | 0.619 |
| 1976 | 1 | -- | 0 | 0.305 | 1.350 | 125 | 161 | 0.233 |

